Table of Contents
TL;DR: How much performance difference is there between running the 14900K at 125 and 253 W?
The overall performance impact between running a 14900K at PL1 = 125 W and PL1 = 253 W is relatively minor in most content creation applications. For workflows like Photoshop, Lightroom, After Effects, Premiere Pro, and DaVinci Resolve, the most performance change was about 4%, but usually around 1-2%.
When doing heavily threaded workloads like CPU rendering or building shaders and lighting in Unreal Engine, the gap can increase anywhere from 10 to 20%, which is a large performance gain, although the Intel 14900K is not the ideal CPU for these workflows. These applications will also see much higher temperatures (20-30 degrees C) when the power limit is set to 253 W.
Introduction
Since the release of the Intel i9-12900K, the Intel Core series of desktop processors have often been criticized for their extremely high power draw and tendency towards high operating temperatures unless paired with a large AIO (all-in-one) water cooler. AMD has been similarly criticized, though to a somewhat lesser degree, since their Ryzen 7000-series launch. Although many of these complaints can be laid at the feet of motherboard manufacturers having default settings that apply overclocks to the CPUs or otherwise push settings for “maximum” performance while maintaining broad compatibility (meaning artificially high voltages, and thus heat), it also reflects a change in the manufacturer’s attitude towards what section of the market the “default” settings should target.
Previously, CPU manufacturers tended to recommend as a default setting for their CPUs to be relatively efficient, with recommended settings for boosting keeping average power draw around the rated TDP, and typically CPUs could be reasonably cooled by relatively inexpensive coolers. However, with Intel’s 12th Gen Core (Alder Lake) CPUs, their messaging towards the DIY/enthusiast market changed from recommending their standard power profile to recommending their “extreme” power profile. Similarly, with the Ryzen 7000-series, AMD adjusted the default behaviors for their boosting technology, with the expectation that their CPUs would run at 95 degrees Celsius—and that this was acceptable.
At Puget Systems, we offer workstations for professional use cases, where the balance between performance and reliability is a bit different than it is for the DIY/enthusiast market. While we want to provide the highest performance we can to our customers so that they can get the work they need to do done, even more important is to provide the most reliable experience—a fast computer is of no use to you if it BSODs partway through a project resulting in hours of lost work. We also have to take into consideration the fact that our customers may not have the luxury of operating our computers under ideal thermal conditions, may be noise-sensitive, or may desire a system more optimized for efficiency. This means that, although we are constantly reevaluating our stance on boosting technologies and overclocking, we currently are more conservative with many of our settings than most enthusiasts and reviewers.
In this article, we will be exploring two power “profiles” for Intel’s i9-14900K and the impact of using a high-end AIO as compared to our standard cooler, the Noctua NH-U12A. If you want to read more about the new Intel 14th Gen Core CPUs and what separates them from the previous generation, we recommend checking out our main 14th Gen Intel Core Processors Content Creation Review article. That post includes more detailed information on the CPU specifications and an overview of testing results for a range of applications. We have also published a couple of older posts looking at some of these performance-boosting technologies before, such as our looks at MCE with the 13900K and PBO/CPB with the 7950X (although we now enable CPB on all of our Ryzen processors).

Image
Intel Turbo
There are more “boosting” technologies currently active on consumer CPUs than you can shake a stick at, including, but not limited to, Intel’s Turbo Boost Technology 2.0, Turbo Boost Max 3.0, Thermal Velocity Boost, and Adaptive Boost Technology (not to mention AMD’s Precision Boost 2, Precision Boost Overdrive, and XFR). These are then further layered by boosting “technologies” put in place by motherboard manufacturers, such as MCE (multicore enhancement) and CPB (core performance boost), which frequently adjust and/or enable the aforementioned technologies and also tweak other settings such as voltage or clock frequency. Covering the differences between all of them would require a small novel, but for our purposes, we can focus on Intel’s Turbo Boost 2 technology as the rest tend to build upon it.
TB2 works to maximize performance by allowing the CPU to increase the core multiplier and, thus, the operating frequency up to the maximum frequency. However, increasing frequency typically requires a higher voltage to maintain stability, and increasing voltage will typically increase power draw. If a CPU were limited to only running at the rated TDP, then most CPUs would not be able to boost clock frequencies very high. What TB2 does to address this is to allow for two power limits to be specified, which can be different from the TDP, that it can operate at to boost frequencies.
The first of these power limits is PL1. This is essentially the baseline power that the TB2 algorithm will attempt to maintain over a time period (Tau). Intel uses a complicated algorithm to see whether the CPU is not exceeding PL1 over the time period, but it can be thought of as an average that cares more about the period of time nearer to the present. The second of the power limits is PL2. This is essentially the maximum power that the CPU can draw over a very short period of time. When TB2 is active, and there is a workload that requires a high power state, TB2 will permit the processor to increase power draw up to PL2 until the time-average power draw over Tau would exceed PL1, at which point the processor will then reduce power consumption to maintain PL1. When PL1=PL2, the value for Tau is functionally useless.
Historically, the default settings for these have been PL1=Thermal Design Power (TDP, 125 W), PL2=Maximum Turbo Power (253 W), and Tau=56 s. However, since their 12th generation, Intel has been setting PL1=PL2 (the full 253 W for both) by default on “K” SKU processors.
At Puget Systems, we currently go against Intel default guidance and set TB2 to operate with PL1=125 W, PL2=253 W, and Tau=56 s. Many reviewers and enthusiasts set these to an “extreme” specification, where PL1=PL2 at 253 W and the current limit for the CPU is increased—Intel has added this higher performance profile to the CPU specification, including an elevated ICCMax of up to 400 A. This typically means that, with sufficient cooling, the CPU will be limited by maximum frequency or voltage rather than power.
Test Setup
Intel Core i9 Test Platform
| CPUs: Intel Core i9-14900K |
| CPU Coolers: Noctua NH-U12A LIAN LI Galahad II Trinity SL-INF 360 |
| Motherboard: ASUS ProArt Z690-Creator WiFi BIOS: 2703 |
| RAM: 2x DDR5-5600 32GB (64 GB total) |
| GPU: NVIDIA GeForce RTX 4080 16GB Driver: Studio 537.42 |
| PSU: Super Flower LEADEX Platinum 1600W |
| Storage: Samsung 980 Pro 2TB |
| OS: Windows 11 Pro 64-bit (22621) |
Benchmark Software
| Photoshop 24.7.1 – PugetBench for Photoshop 0.93.6 |
| Lightroom Classic 12.5 – PugetBench for Lightroom Classic 0.94 |
| After Effects 23.5 – PugetBench for After Effects 0.95.6 |
| Premiere Pro 23.3.0 – PugetBench for Premiere Pro 0.95.6 |
| DaVinci Resolve 18.6 – PugetBench for DaVinci Resolve 0.93.2 |
| Unreal Engine 4.26 |
| Unreal Engine 5.1 |
| Cinebench R23.2 |
| Blender 3.4.0 |
| V-Ray 5.02.00 |
In order to investigate the impacts of power limit settings on CPU performance, we tested in a variety of benchmarks with the 14900K on an open-air testbed. We tested with both our standard cooler, the Noctua NH-U12A, with the rear fan removed, and with the Lian Li Galahad AIO 360.
For this testing, any overclocking functions were disabled, and motherboard settings were controlled. Specifically, ABT, TVB, and MCE were disabled, and PL1, PL2, and Tau were manually set. We performed testing on multiple 14900Ks to minimize the influence of CPU variance, poor mounting, and thermal interface material application. The ambient temperature of the testing room is controlled. We used our standard fan curve for this testing, which does ramp, but will reach 100% fan speed at 70 degrees Celsius; heavy all-core workloads remained at 100% fan speed for the duration of the test.
When interpreting the performance results, there are two things to examine: performance changes due to increased boosting and performance changes due to better thermal management. However, these two factors are potentially related, as a system that is improperly cooled will not boost as much, while increasing thermal headroom allows for the possibility of greater boosting. To that end, we will typically first look at whether increasing the power limit increases performance. If so, we will then analyze both coolers at that power limit. If it doesn’t, we will instead examine both coolers at the lower power limit, as this indicates either not needing the extra power to achieve maximum boost under the load or potentially thermal throttling severe enough to prevent much boosting at all.

Photography

System Image
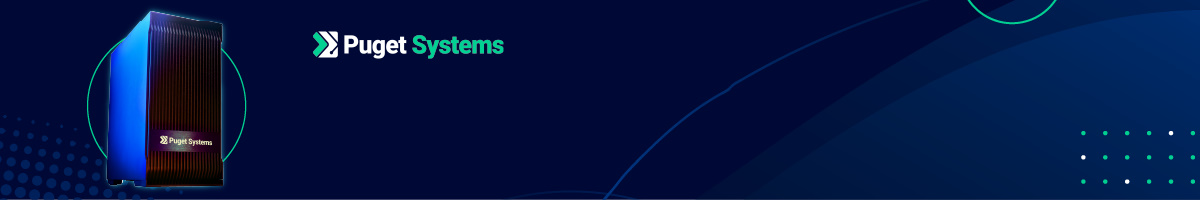
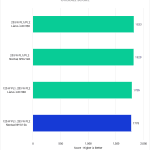
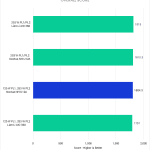
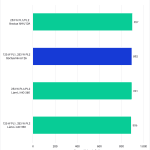
Starting with two photography applications we tested, Lightroom Classic and Photoshop, we see that changing power limits has effectively no effect on performance. The largest change we see here is less than 3%, which is within the margin of error for these tests. The 253 W configurations both perform slightly better, so it is possible there is actual performance gain here, but it is sufficiently small to not matter in most circumstances.
Video Editing and Motion Graphics
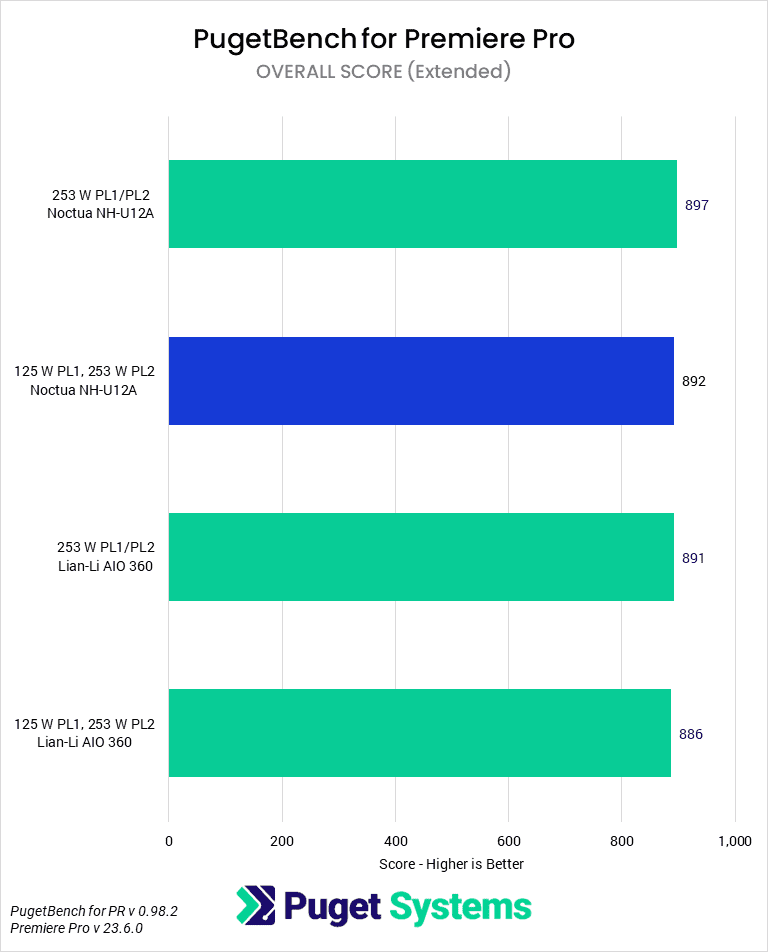
Moving on to the PugetBench results for Video Editing and Motion Graphics applications, we continue to see a trend of relatively little change between coolers and power limits. Premiere Pro offers the least interesting set of results, with no noticeable difference between any of them.
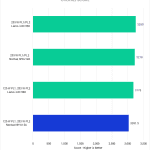
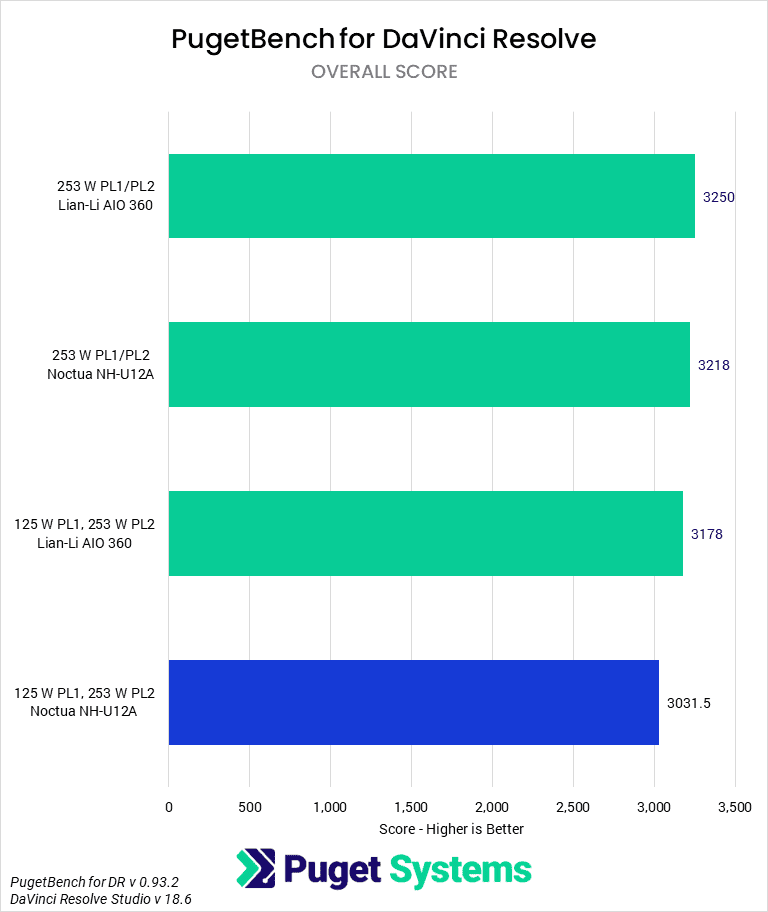
DaVinci Resolve shows potentially a 7% change with the power limits, although the data is not clear that the gap is actually so large, as we observed a 5% gap between the Noctua and Lian Li coolers at 125 W but did not see any thermal throttling when examing temperature logs. Between the Galahad at 125 W and the Galahad at 253 W, we saw a much smaller 2% change.
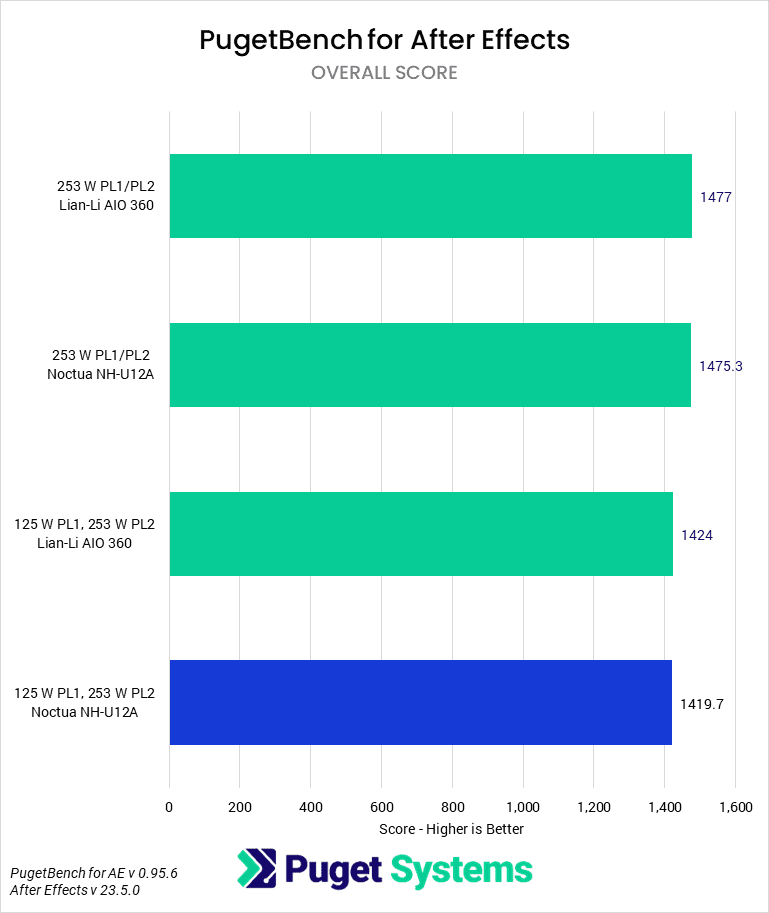
Finally, After Effects showed a much cleaner difference with power limit settings than any of the other applications in this section. Although the maximum change is only 4%, both coolers scored about identically to each other at each power setting, meaning that they were both cooling adequately and that the performance gain was from the increased power limit, not the cooler.
While there may be some small overall benefit to increasing power limits for these applications, almost all the results were within the margin of error. With enough benchmark runs, you could nail down some exact numbers, but in the real world, most users likely will not be able to notice the difference in their workflow.
Game Development
Image
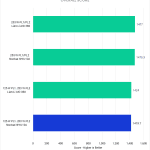
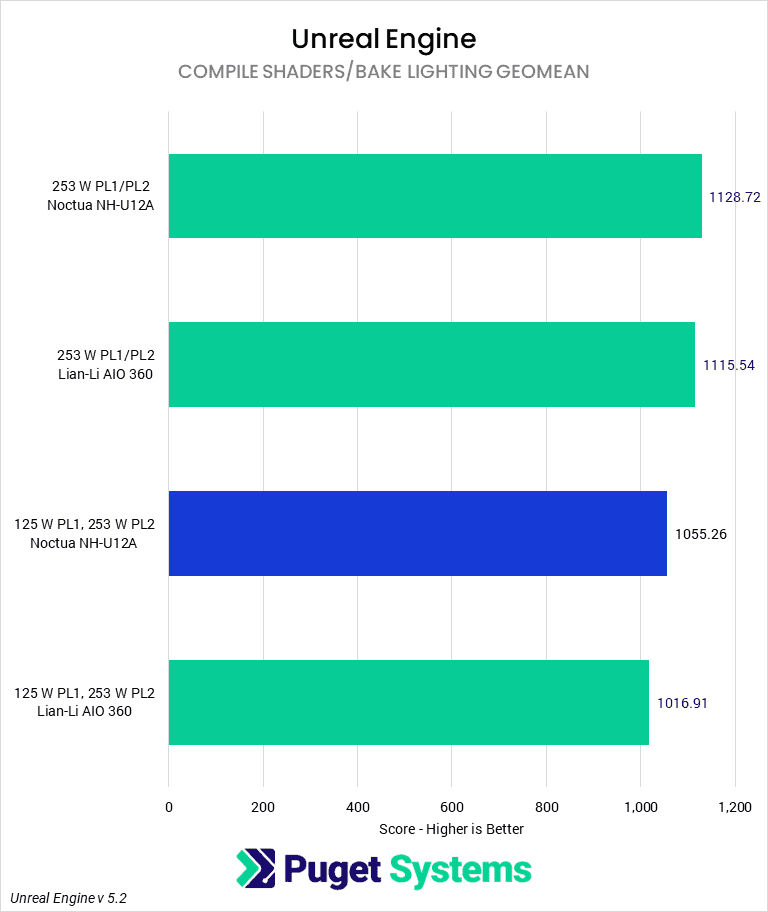
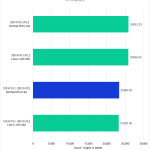
Our Unreal Engine CPU tests can tend to be somewhat more taxing on the processor than many of the prior tests, and we see that in the larger performance delta between power settings. Even if we only consider the average score at either power setting, the results at 253 W are 8.5% higher than at 125 W. The most optimistic reading of this chart increases that gap to 11%. It is also clear that cooler choice makes little difference here, as we see the Galahad performing worse at both power limits (although mostly within the expected error) than the NH-U12A.
These tasks are typically performed infrequently by your average developer, and when they are, will benefit from a machine with many more cores than is available on a desktop CPU. Nonetheless, for someone who finds themselves doing a lot of these tasks on their desktop machine, increasing power limits is a free way to decrease the time it takes to complete these tasks.
CPU Rendering
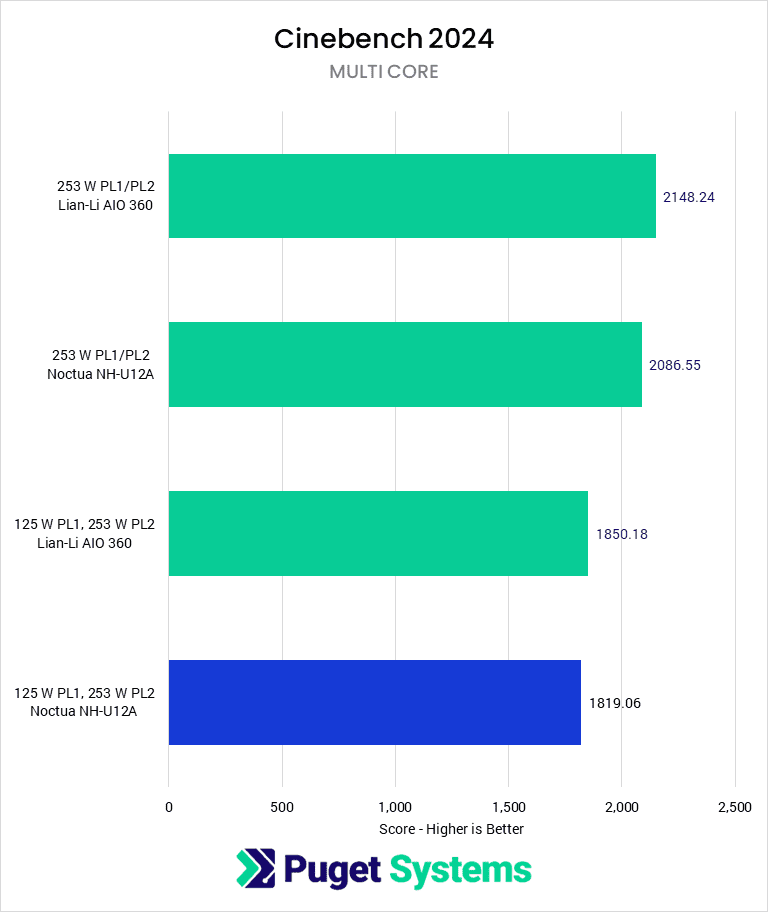
The tests that should best discriminate between coolers and power settings from our suite of benchmarks are CPU renderers, of which we tested 3. Cinebench 2024 shows a large 18% performance difference between the Galahad at 253 W and the Noctua at 125 W. It also appears that coolers matter here, at least at the higher power draw, as the larger cooler scores 3% higher than the smaller one.
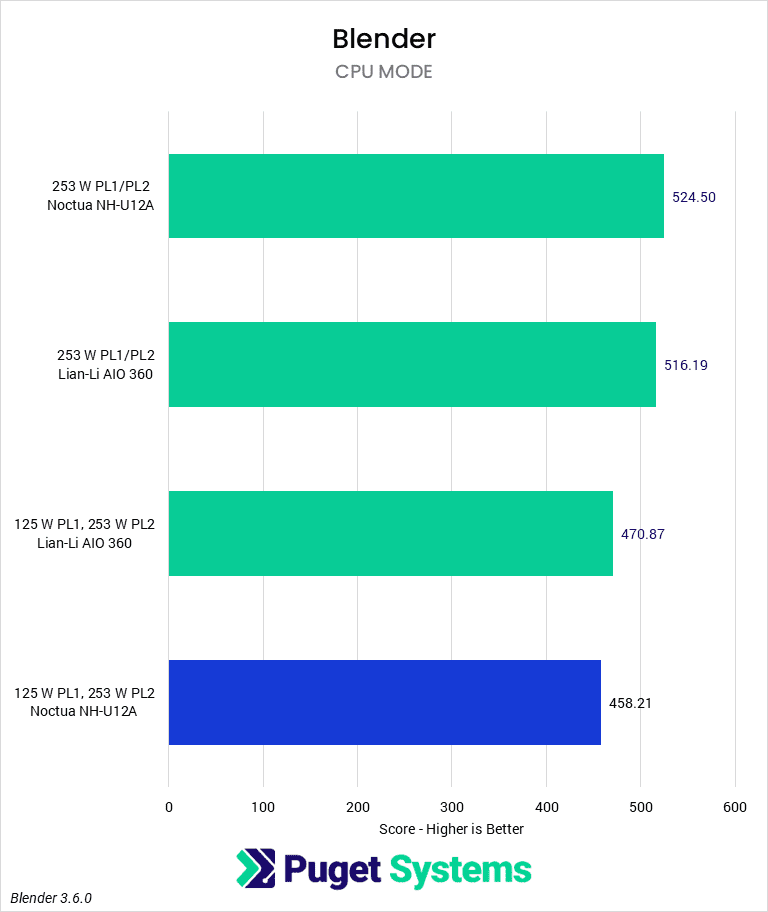
Blender shows a smaller gap than Cinebench, but it is still fairly large at 14%. Both coolers perform identically in these tests, so it once again appears that we are being limited by a factor other than thermals.
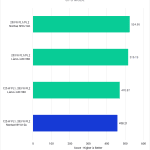
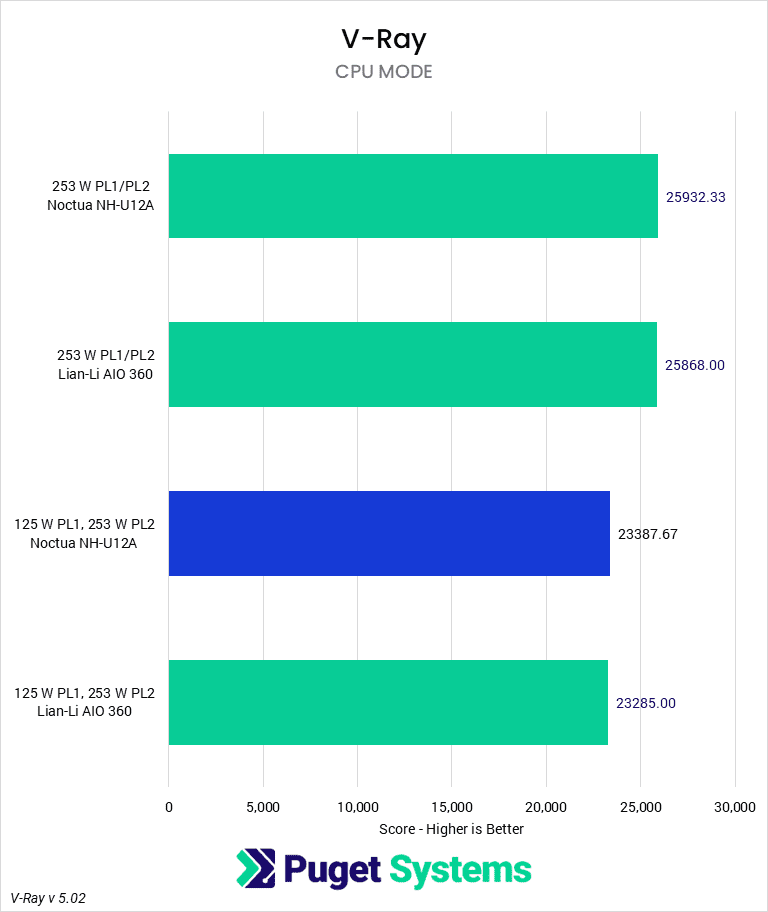
The final benchmark we tested was V-Ray. In the CPU rendering portion, we see a noticeable gap of 11% between the two power limits. Much like Blender, the Noctua nominally outperforms the Galahad at the higher power limit, although within the margin of error of the test.
Overall, CPU rendering showed some large performance gains from increasing the power limit on the CPU to 253 W, regardless of the cooler used, which makes it an attractive option to increase performance in those applications. However, even at those higher power levels, the 14900K is not particularly suitable for CPU rendering, which is best done on a platform with far more cores and RAM, like Threadripper Pro, Intel Xeon-W, or possibly even AMD Epyc.
Temperatures and Power Draw In Select Applications
Though not as in-depth as we hope to go in the future, we decided to examine the actual CPU power draw and temperatures for the applications we tested. Many of our applications behave nearly identically in these regards, so we pulled out a few results that are representative.


Starting off by looking at core temperatures, we see that Photoshop, due to its light workload, fails to show any difference between the coolers regardless of power settings. Both coolers are fully capable of managing the heat load that Photoshop causes, and so will idle around the same temperature based on the fan curve.
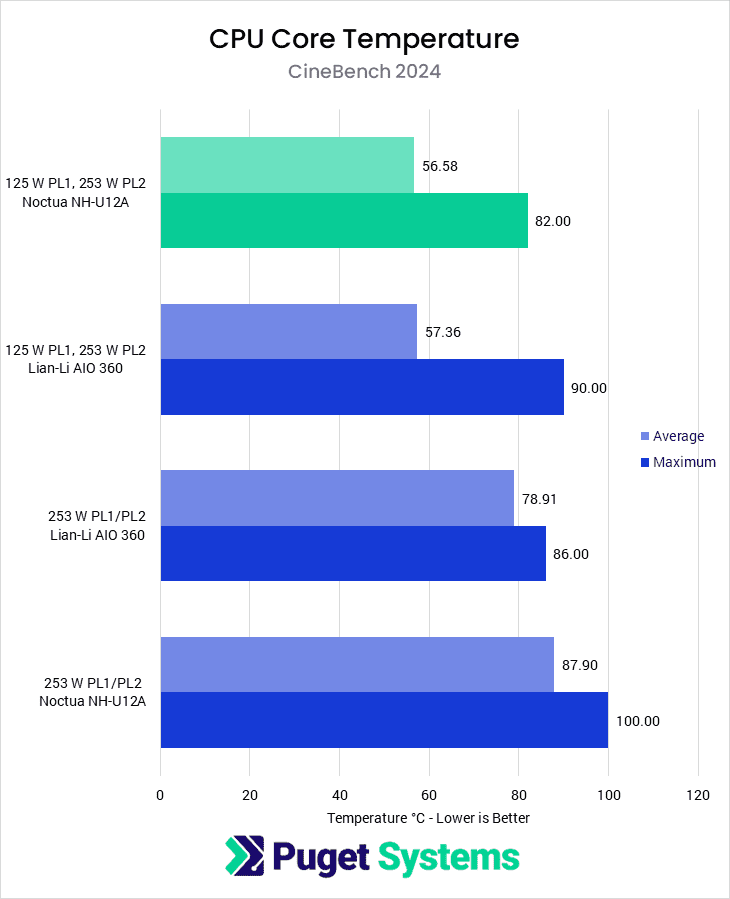
Unreal Engine and Cinebench 2024 cause CPUs to behave similarly, so we will examine them together. Although distinct types of workloads, these are both demanding on the CPU and are heavily multi-threaded. In both cases, the 125 W settings produce the lowest average temperatures, and there is little difference between the two coolers. When examining the 253 W settings, the cooler makes a larger difference, with the Lian Li Galahad reducing temperatures by about 10 degrees Celsius, for both average and maximum temperatures. This shifts us from definitely thermal throttling at times to having some amount of additional thermal headroom for increasing ICCMax, operating in a less forgiving environment, or decreasing fan speed.
Comparing power settings, we see that increasing from 125 W PL1 to 253 W PL1 causes a large spike in temperatures of 20 to 30 degrees Celsius, depending on the cooler being used. Although a high temperature is not necessarily cause for concern in and of itself, it will frequently correlate with more noise, less headroom for additional boosting, and possibly decreased CPU lifespan.
In other words, it is a good idea to have a more powerful AIO cooler if you plan to run extremely heavy, highly threaded workloads on the Intel Core i9-14900K while maximizing performance via power settings. For the more typical workload this class of CPU is used for, however, setting the extreme power limits and using a large cooler isn’t as necessary from either a performance or thermal standpoint.
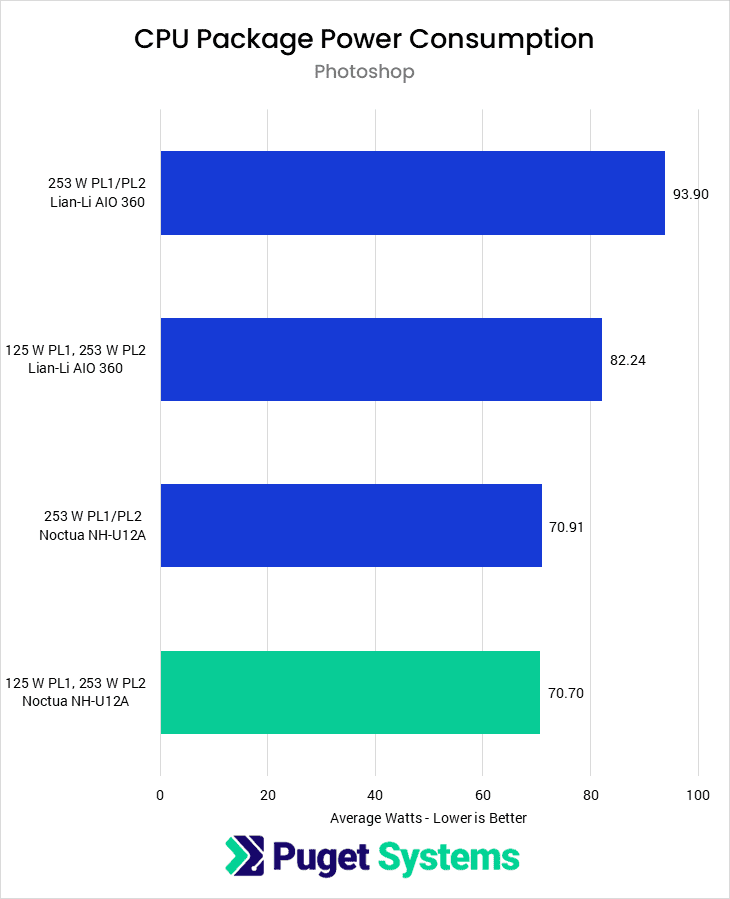


Moving on, we also recorded the average power draw used to complete each of the benchmarks. When examining this alongside the score in each of the benchmarks, you can get an idea of the efficiency with which work was completed. In general, increasing the power limits will decrease CPU efficiency, as power draw increases more than linearly with frequency.
Photoshop is somewhat odd in these results in that the Noctua coolers at both power settings both drew about 70 W on average, while the Galahad coolers drew more than this. At 125 W PL1, the Lian Li drew 82 W, while at 253 W PL1, 94 W. We really don’t have a great explanation for why the Lian Li AIOs are drawing more power than the Noctua coolers. At 253 W PL1, the Galahad maintains slightly higher average clock frequencies, but the 125 W PL1 Galahad averages the same frequencies as the Noctua tests. Regardless, while the difference between 70 and 90 Watts is noticeable, both are sufficiently low as to not really matter and show that the CPU does not even require the base TDP to max out boosting in Photoshop.
Once again, Cinebench and Unreal Engine are a different story. In this case, with PL1 set to 125 W, both coolers stay pinned at that power draw, as they are able to keep many more cores occupied and will use up as much of their boosting power budget as possible. We see here that TB2 is doing its job and keeping them from exceeding PL1 on average.
With PL1 set to 253 W, we see a bit of different behavior. In Unreal Engine, both CPUs average about 240 W throughout the test. This is slightly above the PL1 setting, but it is near enough given how the boosting algorithm works and which sensors are being monitored—both CPUs are boosting as high as possible. In Cinebench, the Noctua cooler actually averages nearly 40 W less than the Galahad. In this case, it is because the Noctua cooler is actually throttling and reducing boost clocks. It is unclear why we see so distinctly in Cinebench but not Unreal Engine despite similar temperatures, but they are different workloads that may be spiking onto CPU cores differently.
How much of an impact does increasing the power limit have on content creation performance?
One of the benefits of Intel and AMD continuing to push their processors to extract as much performance from them as possible is that it provides users with the option to tailor their computers to their needs. Someone who wants a nearly silent machine can reduce power limits, enable a low-power power mode, and get a cooler that will run with minimal fan speeds. Conversely, an enthusiast can max out power limits, increase ICCMax, set a high-power power mode, and make their fans go full-tilt 24/7. What you decide to do depends on the balance of the factors you have to consider.
Our testing has found that most content creation applications are not that sensitive to increases in power limits. Photoshop, Lightroom, and Premiere Pro saw no real improvement, while After Effects and DaVinci Resolve saw only marginal ones; the differences were right at the margin of error for this kind of real-world testing. These are the applications that are most likely to end up with a CPU like the Intel 14900K, as they are the applications that it tends to excel in compared to other options.
There were some applications that were impacted quite heavily by increasing power limits, however. Unreal Engine shader compilation and light baking saw a 10% increase in performance, as did V-Ray, while Blender and Cinebench 2024 realized gains of up to 14 and 18%, respectively. But, these aren’t typically applications that the 14900K is ideal for, instead preferring a CPU with more cores like a from the Threadripper PRO line. Although more expensive, a CPU like that will frequently pay for itself relatively quickly for any professional use, given the time savings.
Overall, how you configure Turbo Boost 2.0 settings depends on what you are trying to optimize your CPU for. On the one hand, in some applications, allowing the CPU to draw as much power as it can will net you upwards of 18% performance in certain workloads. On the other, it will increase the power draw (and decrease efficiency), increase heat output, and possibly increase the noise of your system. It is good that Intel is giving us access to the features necessary to tailor our systems to our needs in a way that stays within warranty and maintains system stability.
Currently, at Puget Systems, we’ve found that the balance of the factors is such that our computers make more sense targeting the 125 W power limit than the 253 W. Most of the workstations we sell with an Intel i9 CPU are for applications like Premiere Pro or Photoshop, which will not realize any benefit from the higher power limits but would see higher power draw, thermals, and noise. We expect to continue to evaluate our stance on the best way to serve our customers through power profiles over this generation of CPUs. Let us know your thoughts on these tradeoffs in the comments or how you have configured your own system to run.
Finding the perfect workstation doesn’t have to be complicated. Explore our solutions page for a curated selection of recommended systems for a multitude of applications and workflows, or visit our custom configuration page if you already know the ideal hardware for your needs. If you need assistance with tailoring a system to a unique workflow or have any other questions, we encourage you to reach out to our dedicated technology consultants.
Looking for a content creation workstation?
We build computers tailor-made for your workflow.
Don’t know where to start?
We can help!
Get in touch with one of our technical consultants today.